


#6 - Heikin-Ashi
An alternative to traditional candlesticks


Intro
As I consider myself a trend follower trader, focused in swing/position trading, I want to talk about Heikin-Ashi (HA) candles - which I’ve been using for quite some time.
"Heikin-Ashi" in japanese means "average/balance bar". The advantages of using HA candles rather than traditional candlesticks are:
Noise Reduction: By averaging prices, they filter out minor fluctuations in price, allowing to focus on the overall trend rather than short-term volatility;
Trend Clarity: Their smoother appearance helps identify more easily when to enter or exit trades; and
Reversal Signals: Similar to traditional candlestick patterns, HA candles can signal potential reversals through specific formations, such as small bodies with long shadows indicating indecision.
The se type of candles were created in the 1700’s by Munehisa Homma, a rice merchant from Sakata, Japan - who is also considered the father of the traditional candlesticks.
Calculation
Like standard candles, a HA candle has a body and a wick. However, they are calculated differently:
HA close: (open + high + low + close)/4
HA open: (open of previous HA candle + close of previous HA candle)/2
HA high: max price considering the high, HA open and HA close
HA low: min price considering the low, HA open and HA close
Compare the images below, to identify the difference between the construction of regular candles x HA candles:

Below, an example of how traditional candlesticks convert to HA candles (two periods of regular candles form a HA candle):

Limitations of Heikin-Ashi
Average data:
Because the Heikin Ashi candlesticks are averaged, they do not show the exact open and close prices. But that can be fixed in TradingView, choosing the option to show the real price, instead of the HA price:

Lagging:
Since the HA candles uses price information from two periods (as shown in the chart I shared before), a trade setup takes longer to develop, compared to regular candles. However, this may be considered not an issue for swing/position traders.
No gaps:
Another important element in technical analysis that is missing from Heikin-Ashi charts is price gaps, because the HA open is the middle point of the previous candle (check the image shared before comparing both types of candles). Many traders use gaps for analyzing price momentum, setting stop-loss levels, or triggering entries.
Interpreting HA Charts
The trend can be identified by observing:
the size of the HA candle; and
the position and lenght of it’s wick.
So, based on those factors, the direction and strenght of the trend can be identified as below:
A strong uptrend is made of HA candles that have a large body and no lower wick:

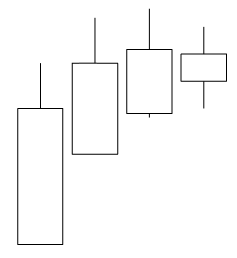
The trend shows weakness when the HA candles have a small body and a lower wick;
On both images shared above, you can see that a doji HA candle (with a small body and lower and upper wicks) indicates indecision, which means a warning about possible trend reversal.
A doji HA candle can also indicate the start of a consolidation period/ranging market. Below, an image that ilustrates that - HA candles color flipping, several weak HA candles and doji HA candles:

Now, look at the example below, that shows downtrend, reversal, and indecision periods:

Conclusion
If you haven’t tried Heikin-Ashi candles, give it a try. The advantages, in my humble opinion, are worth it. They make it easier to identify the trend and possible reversals, as well as support and resistance levels.
Suggestion: try using it with volume indicators and/or momentum oscillators. Personally, I like to use them with Ichimoku Kinko Hyo.
Thanks for reading.