

#19 - Kumo Cloud Deep Dive
An important support/resistance zone


Today, we will talk about the Kumo Cloud. After we’ve seen all Han-ne lines (Tenkan Sen, Kijun Sen, Senkou Span A, and Senkou Span B - check previous posts!), we now dive deep into maybe the most distinctive feature of Ichimoku.
What is the Kumo Cloud?
Kumo means ‘cloud’ in Japanese. Curious note: in the original Ichimoku books, the word ‘Kumo’ is not used, but instead it is called ‘resistance zone’.
Let’s recap what is the Kumo Cloud and how it is formed:
It is the area between Senkou Span A and Senkou Span B. Below, we have a chart with the Kumo Cloud, colored in red and green:
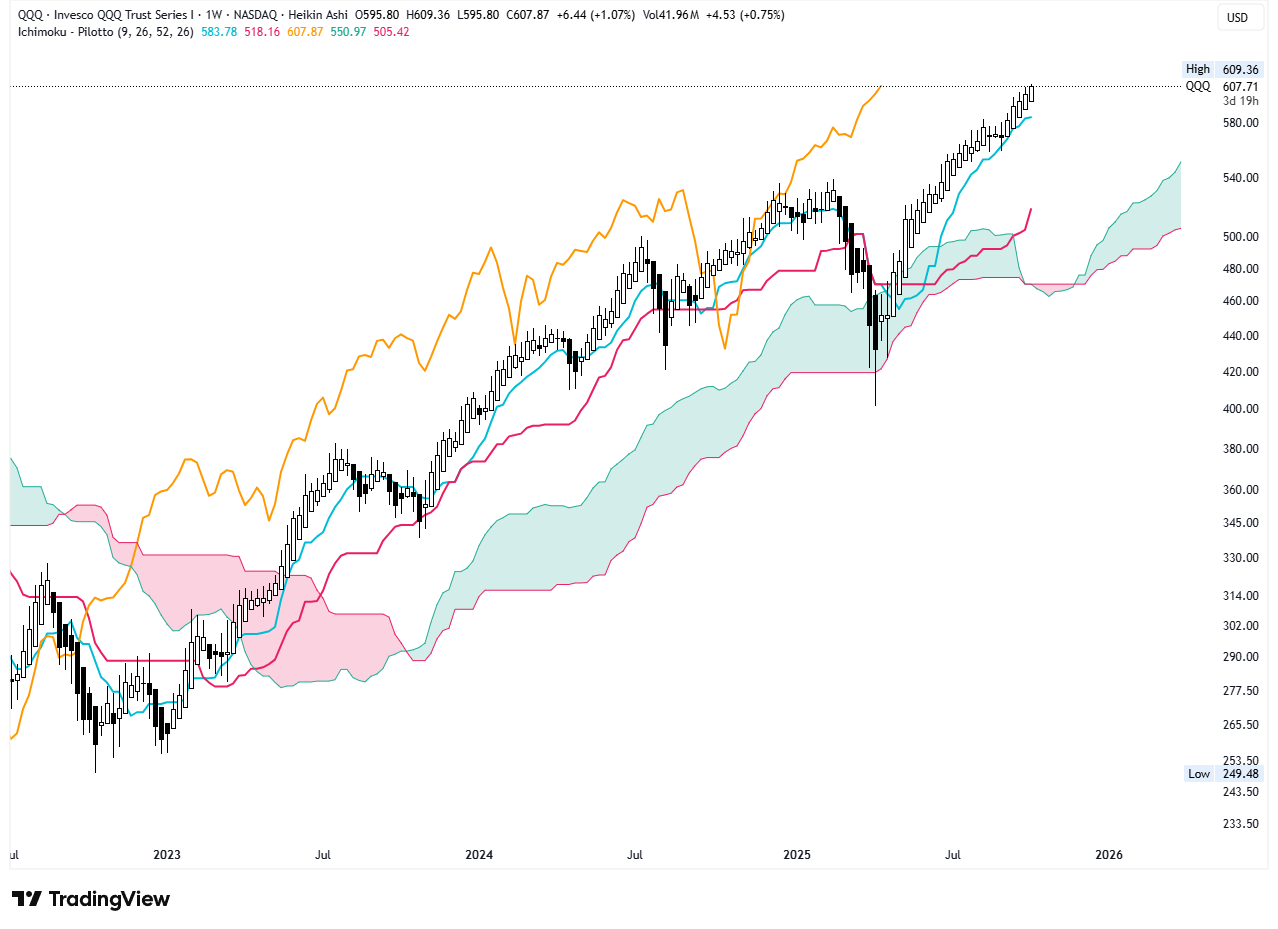
As stated in previous posts (check out the Post #17 and Post #18), Senkou Span A and Senkou Span B are two important Han-ne lines (mid-price lines) that are projected 26 periods ahead of price:
Senkou Span A: represents market level / mid-price for short-to-mid-term;
Senkou Span B: represents market level / mid-price for long-term.
Understanding the Kumo Cloud
Let’s bring up again the word back in the original books: resistance zone.
So, if the Kumo Cloud serves as a resistance zone, price may find some friction on it, either bouncing from it or breaking through it.
As the Kumo is the area formed by Senkou Span A and Senkou Span B, these lines serve as resistance lines, as well.
To really grasp the details of the Kumo Cloud, the following characteristics must be observed:
Color
Thickness
Price location
Kumo twist
Color
The color that Kumo is filled indicates a bullish or a bearish environment, as follows:
When Senkou Span A is above Senkou Span B, the cloud is green, indicating bullish conditions;
On the other hand, the cloud is red, signaling bearish sentiment.
Thickness
The thickness of the Kumo serves as a sign of market volatility and the strength of support/resistance levels:
A thick cloud suggests price tends to bounce from it (it can bounce from one or both lines that form the Kumo);
A thin cloud indicates weaker support/resistance levels, making price movements through the cloud more likely.
Obs.: If the Kumo is thin, it signals that there is no trend based on the last 26 periods.
That is because Senkou Span A and B are calculated and placed 26 periods ahead. So, if those lines are close to each other, it means that, for short-to-mid term, and for long-term, mid-price/market levels have been similar, signaling a consolidation/ranging market.
Price location relative to the Kumo
The location of price relative to the Kumo means three distinct market scenarios:
Above the Cloud: indicates a bullish trend, with the cloud acting as dynamic support.
Below the Cloud: signals a bearish trend, with the cloud serving as dynamic resistance.
Inside the Cloud: the market is neutral / ranging / consolidating. Normally, it is a no-trade zone.
The Kumo Twist
It is the cross between Senkou Span A / Senkou Span B (and vice versa), depending on their position.
As we have the TK cross - the crossover of Tenkan Sen and Kijun Sen, which signals changes in mid-term trend, the cross of the lines that form the Kumo Cloud signals changes in long-term trend.
As the lines that shape the Kumo are placed 26 periods ahead, when a Kumo twist occurs, it is an important signal that the long-term trend is likely to change.
Final Words
By understanding the Kumo’s visual language - its colors, thickness, and price location - traders can develop a more integrated market analysis, because all components of Ichimoku must be considered.
Whether you’re using it for Kumo breakout strategies, twist signals, or simply as a trend filter, the cloud provides a comprehensive framework for navigating market uncertainty with better accuracy.
See you at the next post. Ride safe on market waves! 🏄♂️